Title:
Defensive Impact Wins:
Poster
Preview Converted Images may contain errors
Poster
Preview Converted Images may contain errors
Abstract
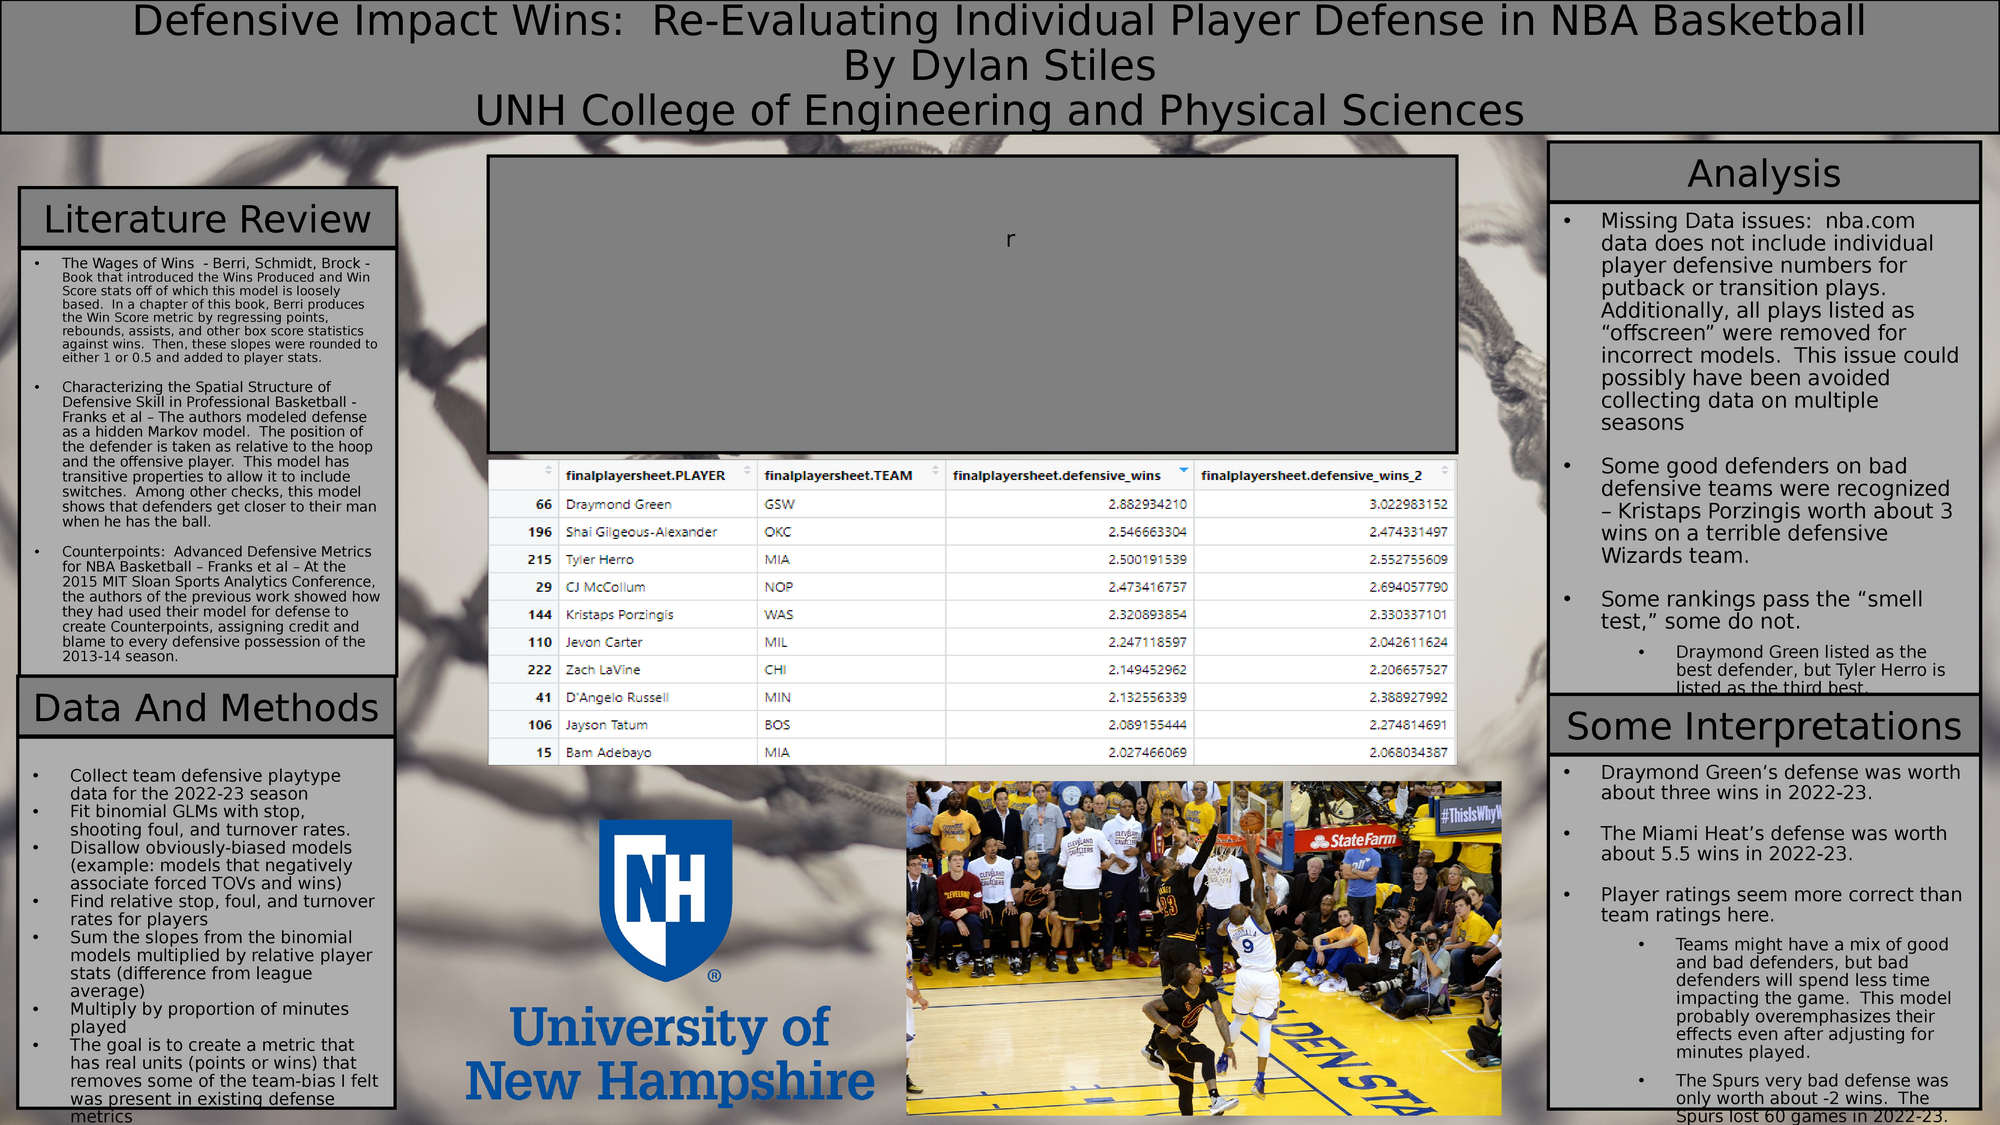
With the analytics revolution in sports in the past 20 years, it seems that everything that can be quantified is. In basketball though, trying to break the game down into a set of numbers comes with a unique problem. While we've come up with a good set of advanced numbers to measure offensive efficiency, defense is fundamentally harder to quantify. The game is played five on five, but it has often been popular or convenient to model defense as a set of five one on one games. As defenses became more complex into the 2010s, this methodology became more insignificant. Other metrics seemed to rely too much on the idea that basketball is a team sport, and have a hard time identifying good defensive players on bad defensive teams, and vice versa. Previous examples of defensive analytics include simply counting points per possession by each defender, defensive rating (points allowed per 100 possessions while a certain defender is in the game), and defensive win shares. I first collected team-level defensive data from the 2022-23 season split by play type from the NBA's website. Using binomial regression, I regressed wins and losses against stop rates, foul rates, and forced turnover rates, creating 27 possible models. I then took all of the slopes that were both significant and allowed (did not say something like "forcing more turnovers is associated with fewer wins") and multiplied them by the players' rates above league average. After adding those up, I centered it by subtracting the mean so that a league average defender is worth zero wins. There were issues that hurt the success of this model, as just 12 of the 27 slopes I fit actually made it in. Six of these slopes were missing because the playtype numbers are not stored on NBA.com at the player level. Some others were disallowed or non significant, things that could have possibly been prevented by using more than one season of data. Unlike many metrics, this doesn't seem to be applicable to the team level at all - elite defensive teams had their entire roster add up to about +5.5 wins, and elite defensive teams usually win about 50 games.
Authors
| First Name |
Last Name |
|
Dylan
|
Stiles
|
Leave a comment
Submission Details
Conference URC
Event Interdisciplinary Science and Engineering (ISE)
Department Mathematics and Statistics (ISE)
Added April 19, 2024, 10:48 a.m.
Updated April 19, 2024, 10:48 a.m.
See More Department Presentations Here