Title:
Visual Graphs and Insigths for Home Heating Fuel Consumption
Poster
Preview Converted Images may contain errors
Abstract
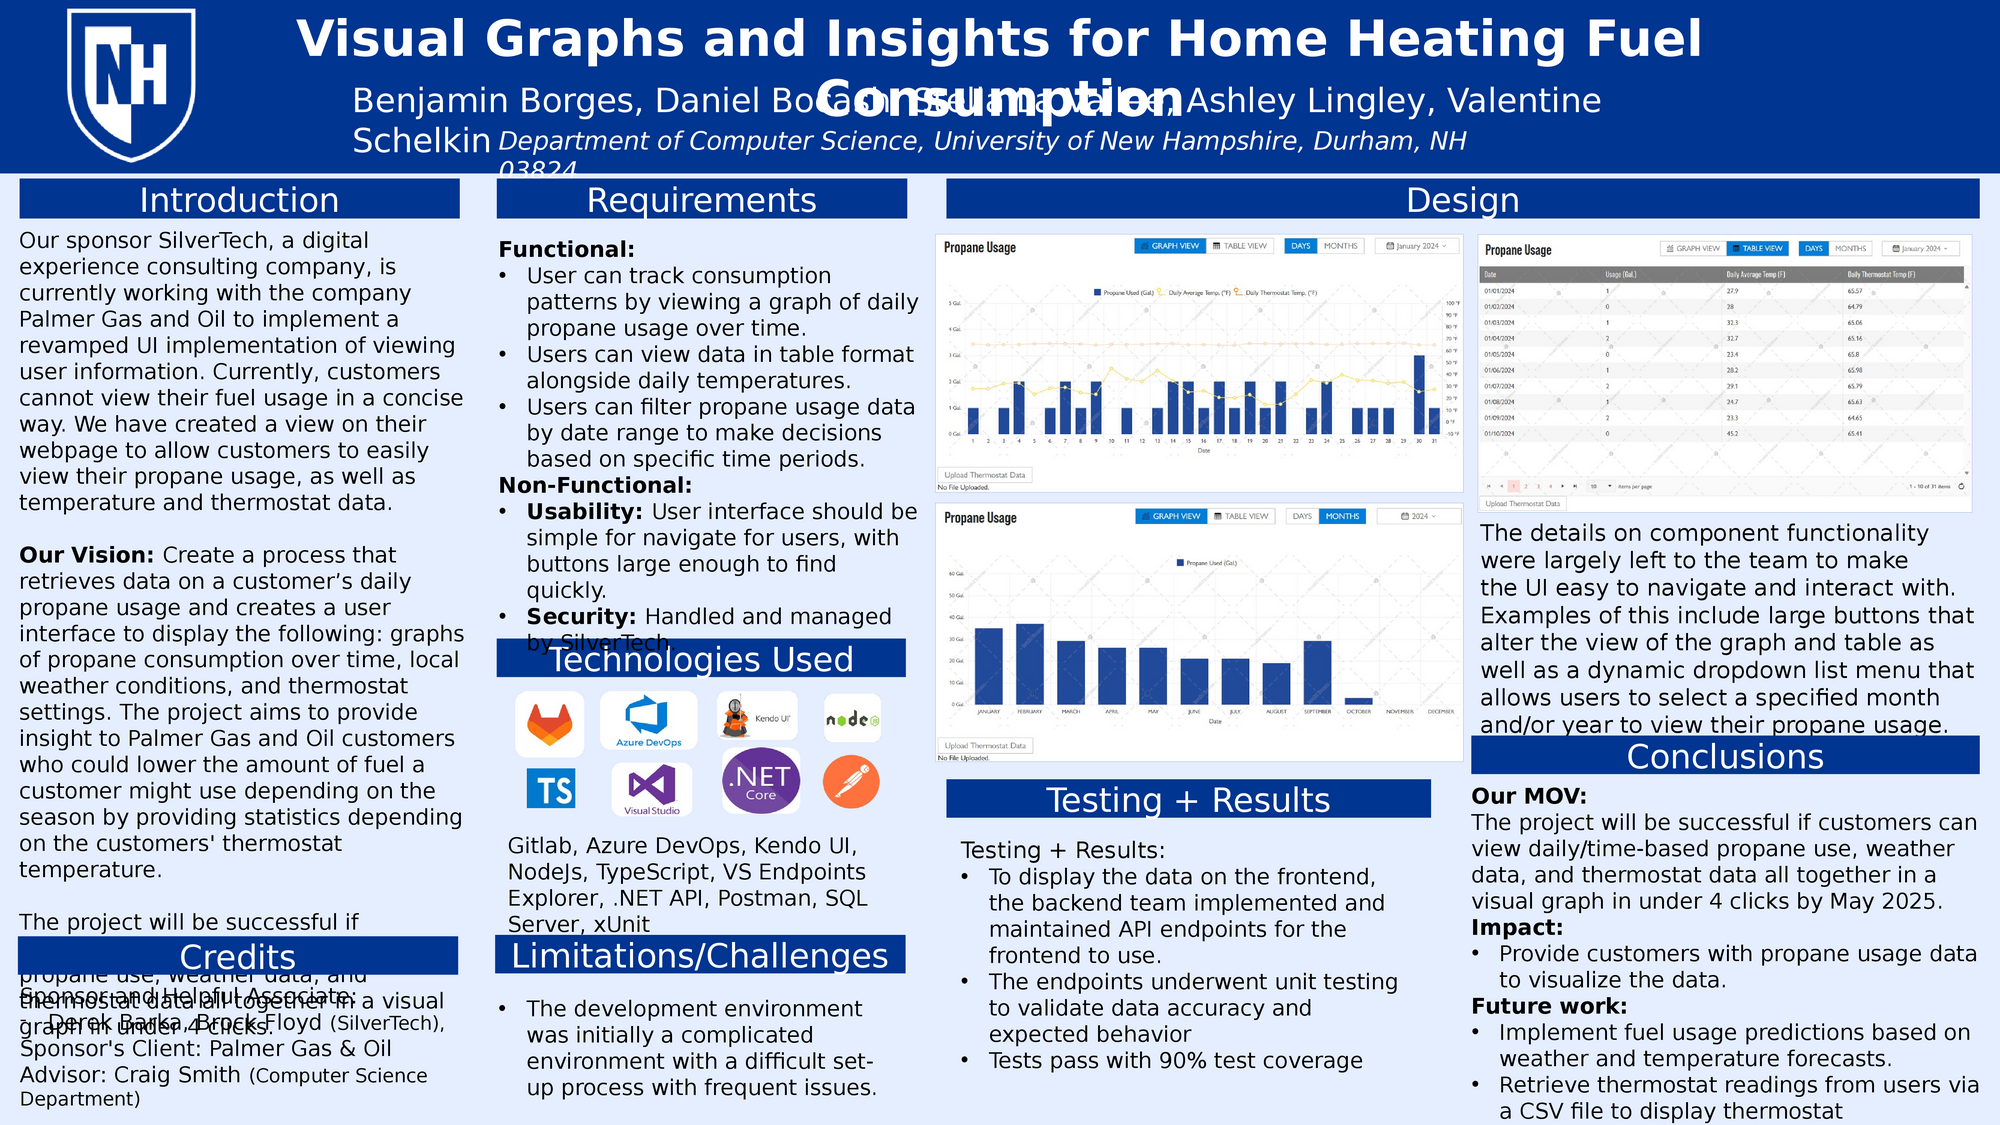
Palmer Gas is a local gas and oil provider that emphasizes the experiences of their customers. In their current customer portal, they are lacking a visual aid to show users their gas usage. To remedy this, Palmer Gas is working with SilverTech, a digital experience consulting company, to add new features to their customer portal and enhance the user experience. Our team is working with SilverTech to create the portion of the user interface that will dynamically display the customer’s fuel usage, thermostat data, and weather data specific to their location. This new UI will provide insights to the customers about their fuel usage to help them lower fuel costs and more accurately predict how much fuel they will need for future months based on their past usage data. On the front-end, this project utilizes a JavaScript/TypeScript framework for our components called Stencil, Axios as our HTTP client, and Kendo UI for our visual components. On the back-end, the project utilizes the .NET architecture for API endpoints, a SQL database hosted with Azure, and Postman to manually test API endpoints. The result of this project will be a fully functional, easily navigable web interface that displays personalized fuel usage, weather, and thermostat data to the customer in just a few clicks.
Authors
| First Name |
Last Name |
|
Ashley
|
Lingley
|
|
Valentine
|
Schelkin
|
|
Ben
|
Borges
|
|
Stella
|
La Vella
|
|
Daniel
|
Bocash
|
Leave a comment
Submission Details
Conference URC
Event Interdisciplinary Science and Engineering (ISE)
Department Computer Science (ISE)
Group Applications
Added April 18, 2025, 4:08 p.m.
Updated April 18, 2025, 4:08 p.m.
See More Department Presentations Here