Title:
Prometheus Network Monitor
Poster
Preview Converted Images may contain errors
Abstract
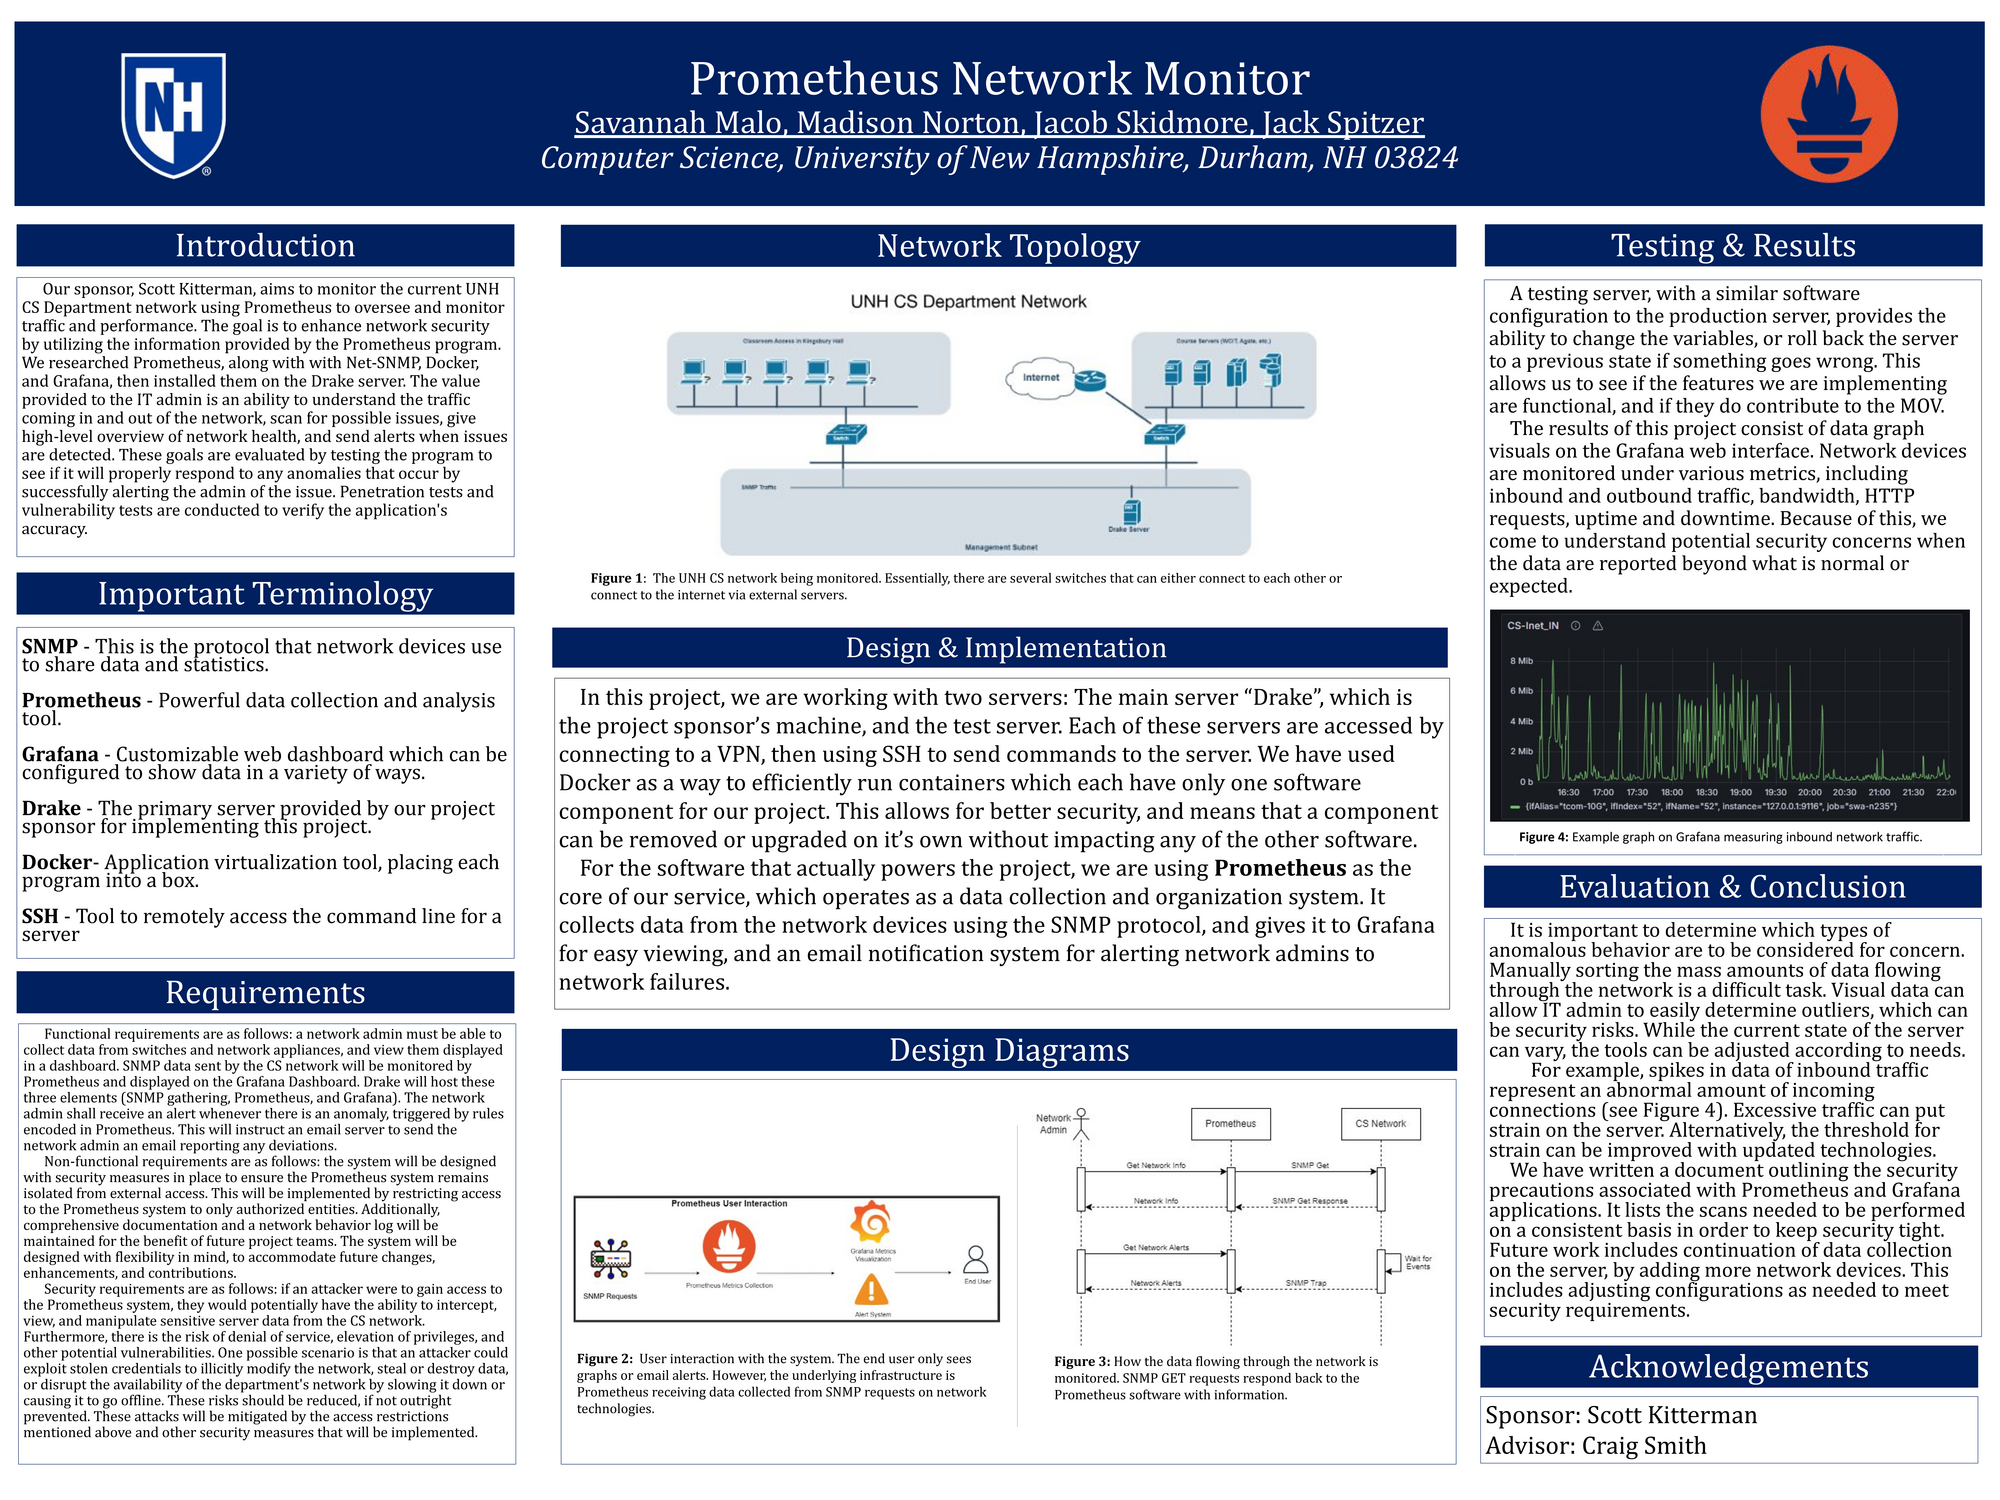
The UNH Computer Science Department network requires assistance with monitoring network traffic and performance. Our project team implemented the Prometheus and Grafana tools on the server to achieve this. The SNMP protocol is used to collect network behavior metrics. Prometheus aggregates the SNMP data and Grafana provides real-time graphical representations on a dashboard. Examples of network behavior tracked are network latency, uptime, HTTP requests, and incoming connections. These interfaces can be interacted with directly on site or remotely through a Virtual Private Network (VPN) connection. Security is acknowledged, as we developed authentication and access restriction methods. Additionally, we have developed a testing environment that mimics the server and tries new functionalities before they are used directly on the server. This project requires knowledge of the network topology to understand the data in context. Future work includes implementing an altering system based on anomaly behavior and connecting more network devices. The ultimate value this project provides to the network administrator is a visual representation of server health data to make better informed decisions for the network with.
Authors
| First Name |
Last Name |
|
Jack
|
Spitzer
|
|
Jacob
|
Skidmore
|
|
Madison
|
Norton
|
|
Savannah
|
Malo
|
Leave a comment
Submission Details
Conference URC
Event Interdisciplinary Science and Engineering (ISE)
Department Computer Science (ISE)
Group Systems
Added April 18, 2024, 3:44 p.m.
Updated April 18, 2024, 3:45 p.m.
See More Department Presentations Here