Title:
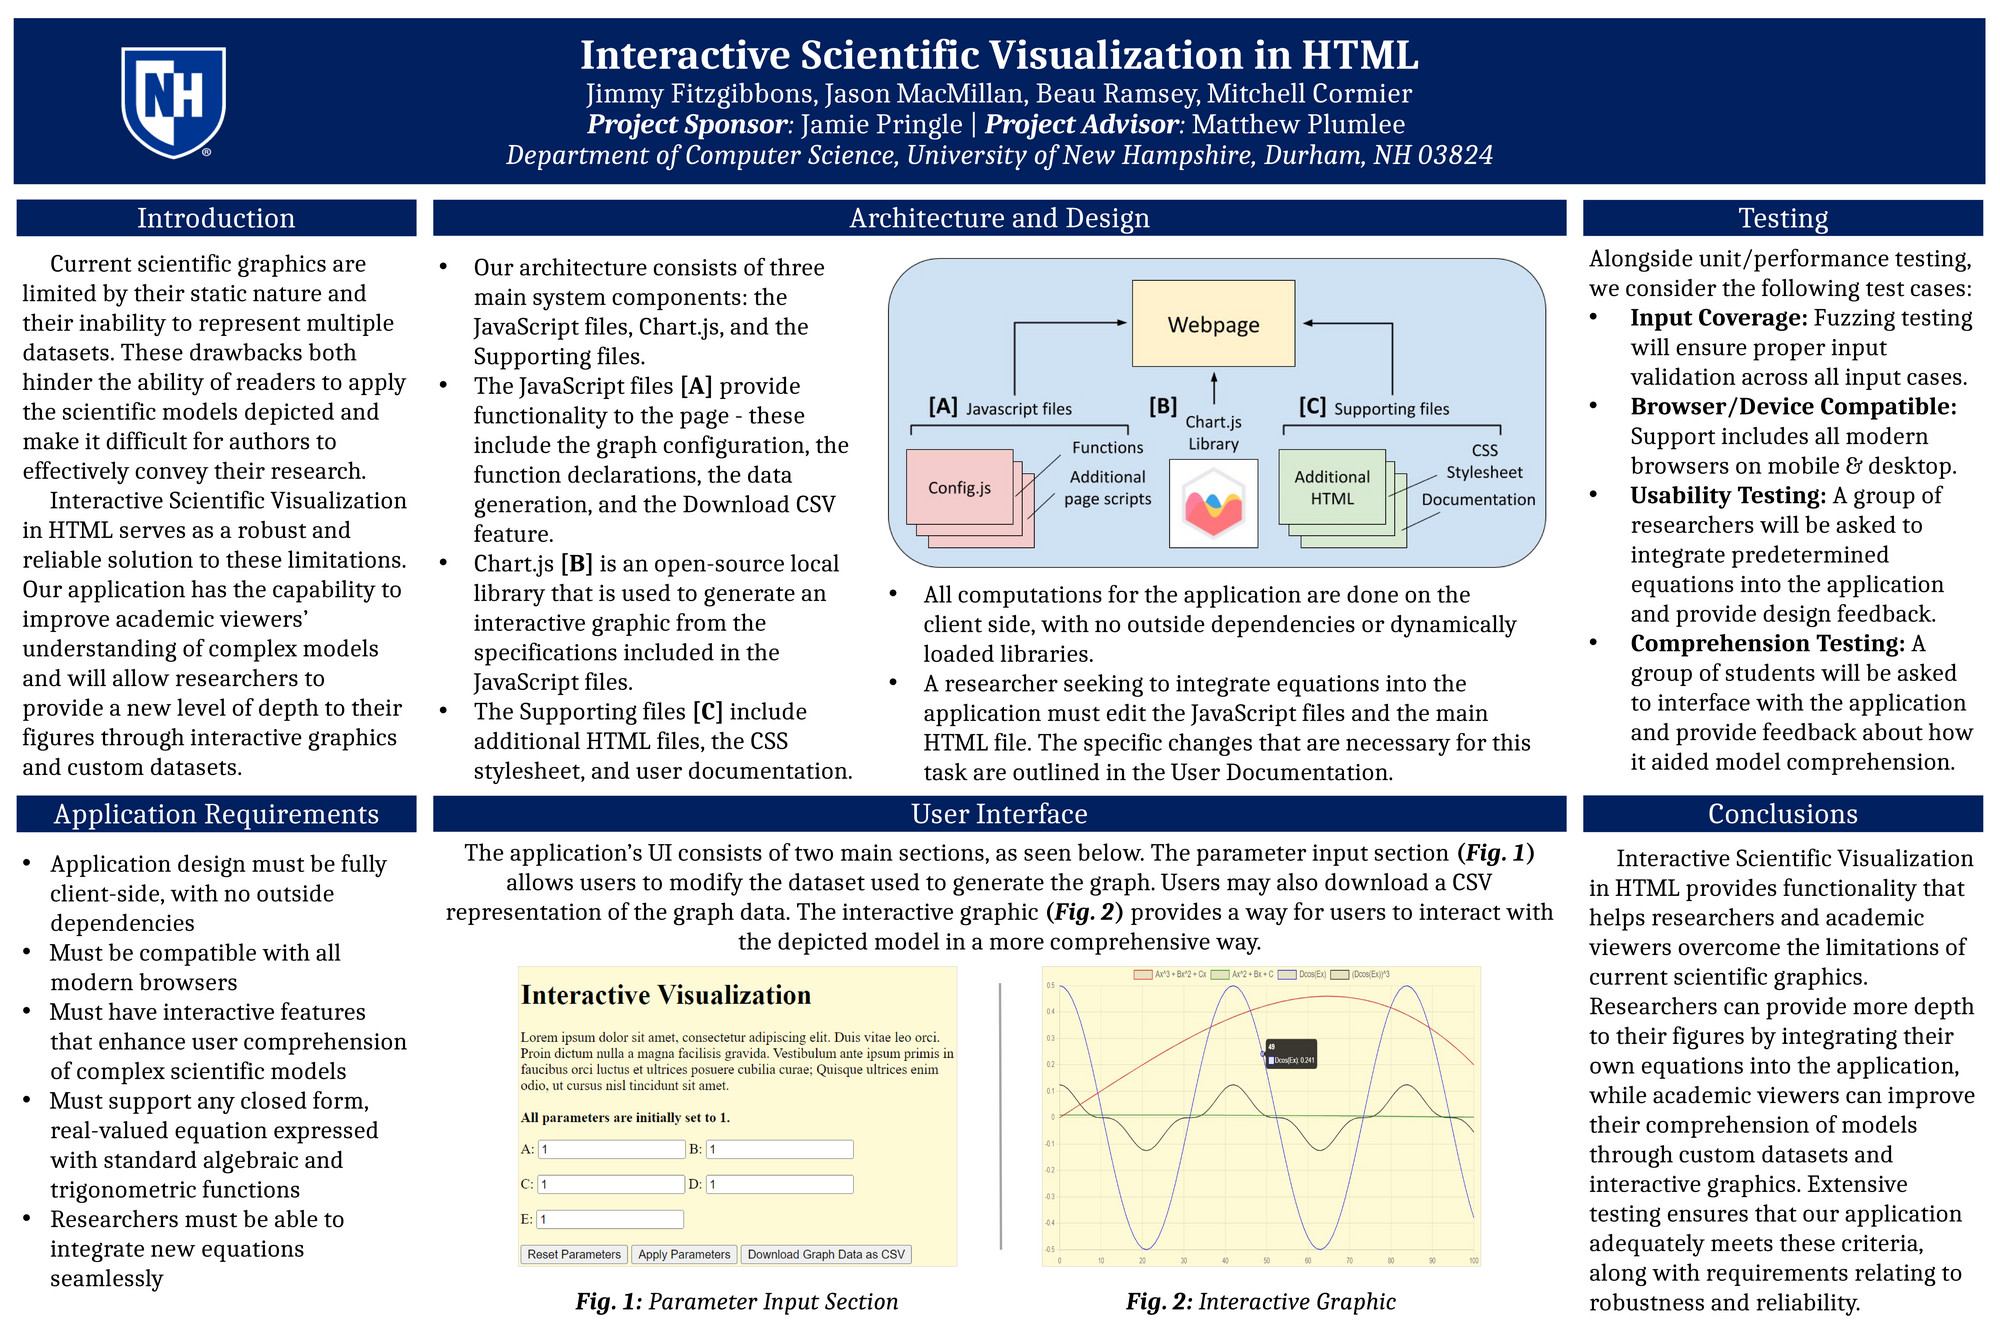
Interactive Scientific Visualization in HTML
Poster
Preview Converted Images may contain errors
Abstract
Current scientific graphics are limited by their static nature and their inability to represent multiple datasets. These drawbacks both hinder the ability of readers to apply the scientific models depicted in these graphics and make it difficult for authors to effectively convey their research. Interactive Scientific Visualization in HTML not only serves as a robust and reliable solution to these limitations, but has been built to withstand the technological changes that will occur over the lifespan of the research it will represent. Our application can support any real-valued equation that can be expressed in closed form with standard algebraic and trigonometric functions and is designed to be compatible with all modern browsers on desktop and mobile. Overall, our product provides value to the scientific community by improving academic viewers’ understanding of complex models and by allowing researchers to provide a new level of depth to their figures through custom datasets and interactive graphics.
Authors
| First Name |
Last Name |
|
Beau
|
Ramsey
|
|
Jason
|
MacMillan
|
|
Jimmy
|
Fitzgibbons
|
|
Mitchell
|
Cormier
|
Leave a comment
Submission Details
Conference URC
Event Interdisciplinary Science and Engineering (ISE)
Department Computer Science (ISE)
Group Applications
Added April 12, 2023, 5:15 p.m.
Updated April 12, 2023, 6:57 p.m.
See More Department Presentations Here